By Kathryn Dennis and Bernardo Vargas-Ángel
The PIFSC cruise HA-14-01 officially concluded yesterday, Monday, June 2, when the NOAA Ship Hi`ialakai arrived back at Ford Island, Pearl Harbor, from Saipan. During this expedition, which began on March 5, scientists from the PIFSC Coral Reef Ecosystem Division (CRED) and partners conducted ecological surveys, collected water samples, and deployed monitoring instruments and platforms at Wake Island and in the Mariana Archipelago as part of the CRED-led Pacific Reef Assessment and Monitoring Program (Pacific RAMP). As a part of the National Coral Reef Monitoring Plan of NOAA’s Coral Reef Monitoring Program, researchers established climate monitoring stations at 4 islands in the Mariana Archipelago and at Wake Island, where integrated activities provide for long-term collection of data on ocean temperature, chemical composition, benthic cover, calcification, bioerosion, and biodiversity to monitor the effects of climate change and ocean acidification.
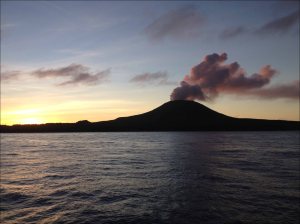
The volcano on the island of Pagan emits plumes of gas and steam on the evening of April 20, as seen in this photo taken during the PIFSC cruise HA-14-01. NOAA photo
From March 25 to May 6, during Legs II and III and part of Leg I of this latest research cruise at Guam and the Commonwealth of the Northern Mariana Islands (CNMI), CRED scientists and partners completed 100 broad-scale towed-diver surveys, covering more than 220 km of coastline and, at Rapid Ecological Assessment (REA) sites, conducted 329 fish surveys and 158 benthic surveys. Members of the CRED Climate and Ocean Change Team installed 15 climate monitoring stations around Guam, Saipan, Pagan, and Maug, deploying 15 subsurface temperature recorders (STRs), 55 calcification accretion units (CAUs), 45 autonomous reef monitoring structures (ARMS), and 75 bioersion monitoring units (BMUs)—in addition to installations of 70 CAUs at supplementary monitoring sites and 55 STRs at strategic locales associated with climate monitoring stations and long-term (>9 years) time series. For a summary of activities conducted and preliminary results from REA surveys at Wake Island during Leg I, go to the previous blog post published on April 10.
A cursory review (prior to the data being fully analyzed) did not reveal any observations of notable changes in the structure of the fish and benthic communities, in comparison with survey results from the previous Pacific RAMP cruise in the Mariana Archipelago in 2011, at Rota, Aguijan, Tinian, Saipan, Sarigan, Guguan, Alamagan, Pagan, Asuncion, Maug, and Farallon de Pajaros in the CNMI or at Guam are reported at this time. However, unusual cold-water temperatures (~17°C) were experienced at Asuncion, Maug, and Farallon de Pajaros, as was volcanic activity that originated mainly from Ahyi Seamount located nearly 18 km southeast of Farallon de Pajaros.
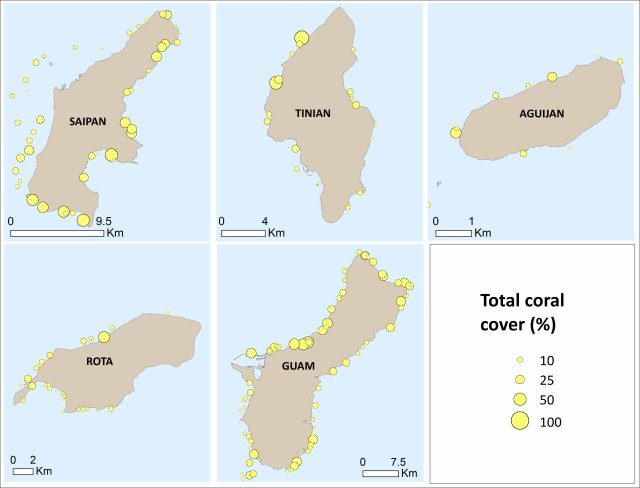
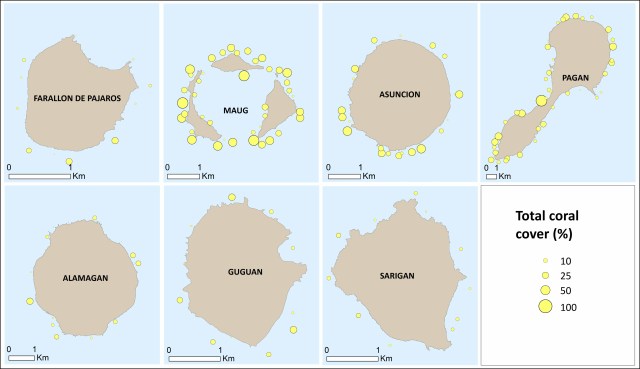
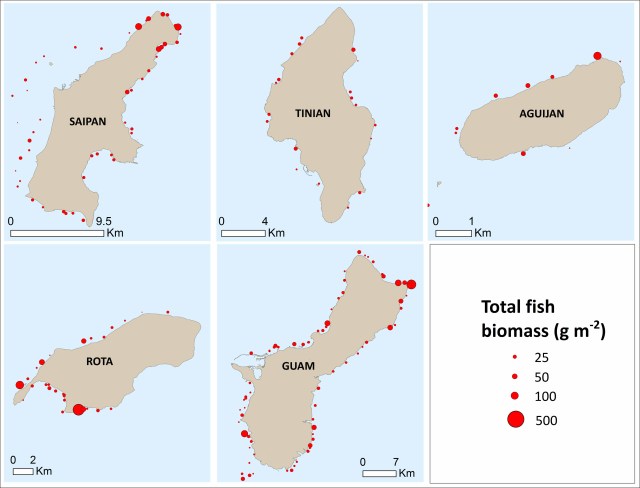
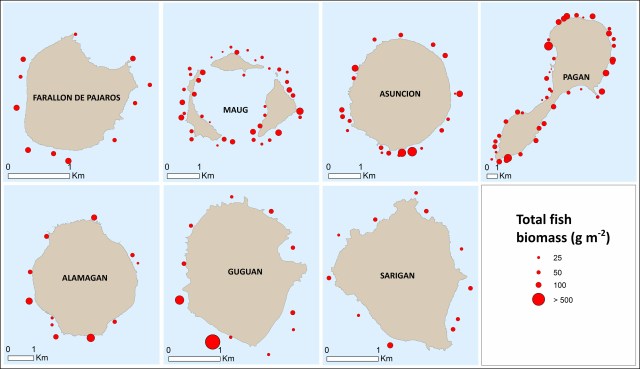
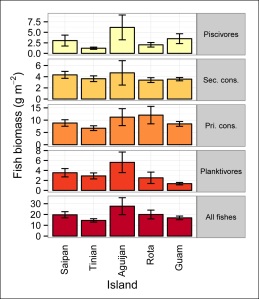
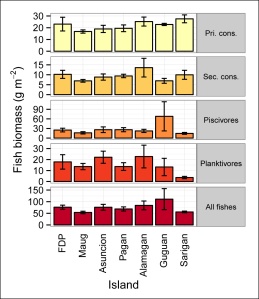
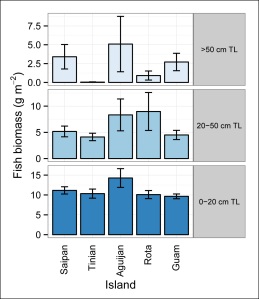
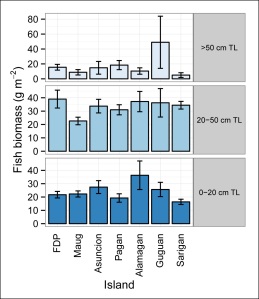
Preliminary results from the surveys at REA sites of fishes and benthic habitat conducted at depths of 0–30 m by scuba divers from the CRED Fish Ecology Team during the PIFSC cruise HA-14-01 are provided in the fish monitoring brief below. The islands on the Mariana Arc can be divided into 2 groups: the old southern islands and the young, volcanic northern islands. The summary below also was published on May 23 (and is available for download) as 2 separate 2-page PIFSC Data Reports, one for the southern islands of this archipelago and the other for the northern islands.
Pacific Reef Assessment and Monitoring Program
Fish monitoring brief: Mariana Archipelago 2014
By Adel Heenan
About this summary brief
The purpose of this document is to outline the most recent survey efforts conducted by the Coral Reef Ecosystem Division (CRED) of the NOAA Pacific Islands Fisheries Science Center as part of the long-term monitoring program known as the Pacific Reef Assessment and Monitoring Program (Pacific RAMP). More detailed survey results will be available in a forthcoming annual status report.
Sampling effort in the southern islands
- Ecological monitoring took place in the southern Mariana Archipelago from March 25 2014 to May 07 2014.
- Data were collected at 178 sites. Surveys were con- ducted at Saipan (n=11), Tinian (n=19), Aguijan (n=10), Rota (n=28), and Guam (n=73).
- At each site, the fish assemblage was surveyed by underwater visual census and the benthic community was assessed.
Sampling effort in the northern islands
- Ecological monitoring took place in the northern Mariana Archipelago from April 19 2014 to May 06 2014.
- Data were collected at 148 sites. Surveys were conducted at Farallon de Pajaros (FDP) (n=11), Maug (n=40), Asuncion (n=21), Pagan (n=43), Alamagan (n=11), Guguan (n=11), and Sarigan (n=11).
- At each site, the fish assemblage was surveyed by underwater visual census and the benthic community was assessed.
Overview of data collected
Preliminary results for fish biomass also are presented by consumer group and size class. Primary consumers include herbivores (which eat plants) and detritivores (which bottom feed on detritus), and secondary consumers are largely omnivores (which mostly eat a variety of fishes and invertebrates) and invertivores (which eat invertebrates).
Spatial sample design
Survey site locations are randomly selected using a depth-stratified design. During cruise planning and the cruise itself, logistic and weather conditions factor into the allocation of monitoring effort around sectors of each island or atoll. The geographic coordinates of sample sites are then randomly drawn from a map of the area of target habitat per study area. The target habitat is hard-bottom reef, the study area is typically an island or atoll, or in the case of larger islands, sectors per island, and the depth strata are shallow (0–6 m), mid (6–18 m), and deep (18–30 m).
Sampling methods
A pair of divers surveys the fish assemblage at each site using a stationary-point-count method (Fig. 9). Each diver identifies, enumerates, and estimates the total length of fishes within a visually estimated 15-m-diameter cylinder with the diver stationed in the center. These data are used to calculate fish biomass per unit area (g m–2) for each species. Mean biomass estimates per island are calculated by weighting averages by the area per strata. Island-scale estimates presented here represent only the areas surveyed during this cruise. For gaps or areas not surveyed during this cruise, data from this and other survey efforts generally will be pooled to improve island-scale estimates.
Each diver also conducts a rapid visual assessment of reef composition, by estimating the percent cover of major benthic functional groups (encrusting algae, fleshy macroalgae, hard corals, turf algae, and soft corals) in each cylinder. Divers also estimate the complexity of the surface of the reef structure, and they take photos along a transect line at each site that are archived to allow for future analysis.
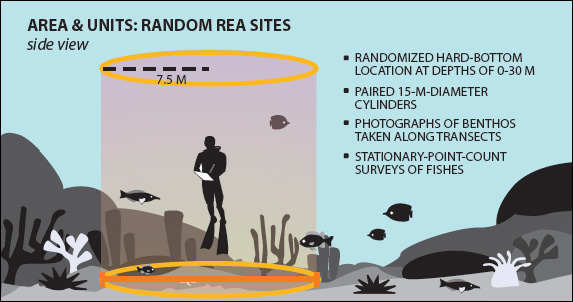
Figure 9. Method used to monitor fish assemblage and benthic communities at Rapid Ecological Assessment (REA) sites.
About the monitoring program
Pacific RAMP forms a key part of the National Coral Reef Monitoring Plan of NOAA’s Coral Reef Conservation Program (CRCP), providing integrated, consistent, and comparable data across U.S. Pacific islands and atolls. CRCP monitoring efforts have these aims:
- Document the status of reef species of ecological and economic importance
- Track and assess changes in reef communities in response to environmental stressors or human activities
- Evaluate the effectiveness of specific management strategies and identify actions for future and adaptive responses In addition to the fish community surveys outlined here, Pacific RAMP efforts include interdisciplinary monitoring of oceanographic conditions, coral reef habitat assessments, and mapping. Most data are available upon request.
For more information
Coral Reef Conservation Program: http://coralreef.noaa.gov
Pacific Islands Fisheries Science Center: http://www.pifsc.noaa.gov/
CRED publications: http://www.pifsc.noaa.gov/pubs/credpub.php
CRED fish team: http://www.pifsc.noaa.gov/cred/fish.php
Fish team lead and fish survey data requests: ivor.williams@noaa.gov
To download a PDF file of PIFSC Data Report DR-14-009, the fish monitoring brief for the southern islands of the Mariana Archipelago, click here.
To download a PDF file of PIFSC Data Report DR-14-010, the fish monitoring brief for the northern islands of the Mariana Archipelago, click here.

