
by Adel Heenan
For the past month, researchers aboard the NOAA Ship Hi‘ialakai have been navigating across the Pacific Ocean to survey coral reef ecosystems at remote Wake Atoll and the Mariana Archipelago. This expedition includes additional surveys at Jarvis Island, in the Pacific Remote Islands Marine National Monument, to assess the reef condition and degree of recovery from a catastrophic coral bleaching event in 2014-2015.


Jarvis Island is located in the central Pacific Ocean, close to the equator, and is a small island in the direct path of a deep current that flows east (Figure 1). Because of it’s position right on the equator and the strong currents hitting the island, Jarvis sits in the middle of a major upwelling zone—where cold nutrient rich water is drawn up from the deep. This water fertilizes the whole area, elevating nutrient levels and productivity in the reef ecosystem (Gove et al., 2006). As a result, Jarvis supports exceptionally high biomass of planktivorous and piscivorous fishes (Williams et al., 2015).


Because it is unpopulated and extremely remote, Jarvis provides an important reference point and opportunity to understand the natural structure, function, and variation in coral reef ecosystems. The island also offers a natural laboratory in which the effects of ocean warming can be assessed in the absence of stressors that impact coral reefs where humans are present (e.g., fishing or land-based sources of pollution).
El Niño, La Niña and the global coral bleaching event of 2014-2015
The Equatorial Pacific upwelling at Jarvis alternates between warm El Niño years, when upwelling is weak and oceanic productivity low, and cold La Niña years where upwelling is strong and productivity is high (Gove et al., 2006). Unusually warm sea surface temperatures, and a strong El Niño in 2014-2015, triggered the third recorded global coral bleaching event. At Jarvis, these warmer waters led to widespread coral bleaching and mortality. High sea surface temperatures in 2015 also impacted upwelling at Jarvis, as evidenced by a decrease in the primary productivity around the island.
Teams from the Coral Reef Ecosystem Program recently completed ecological monitoring at Jarvis from April 2–5, 2017. They collected data at 28 stationary point count sites (Figure 2) this year, 30 in 2016, 62 in 2015, 42 in 2012, and 30 in 2010.
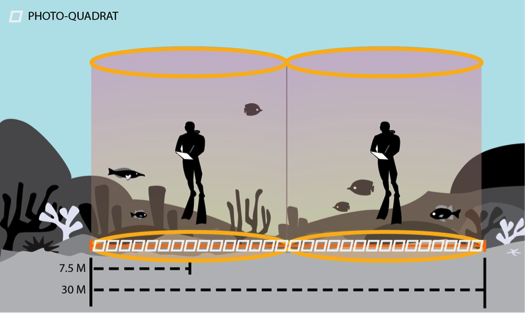
Figure 2. The stationary point count method is used to monitor the fish assemblage and benthic communities at the Rapid Ecological Assessment (REA) sites.
Main Observations
Fish biomass tended to be highest on the western side of the island where equatorial upwelling occurs (Figure 3). In 2016, we observed somewhat reduced total fish and total planktivore biomass (Figure 4), but this reduction was within the normal range of observed variability.


There were some significant reductions observed for individual species in 2016. These reductions were noticeable across multiple trophic groups, for instance the planktivorous Whitley’s fusilier (Luzonichthys whitleyi), Olive anthias (Pseudanthias olivaceus), Dark-banded fusilier (Pterocaesio tile), the piscivorous Island trevally (Carangoides orthogrammus), and the coral-dwelling Arc-eyed hawkfish (Paracirrhites arcatus) which is strongly associated with Pocillopora coral heads. Some of these species had returned to previous ranges by 2017, but others remain depleted (Figure 5).
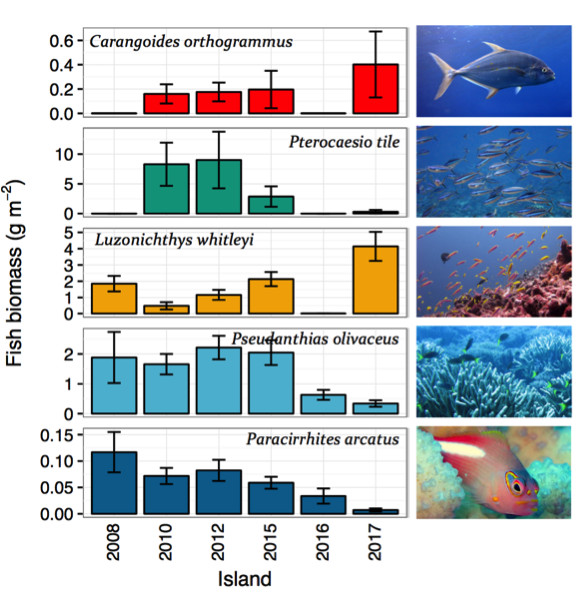
Figure 5. Mean species biomass (± standard error) per survey year at Jarvis.
Very high levels of coral mortality were evident in 2016 surveys and coral cover remained low in 2017. Notably, macroalgal cover increased in 2017, approximately by the amount of coral cover lost in 2016 (Figure 6).
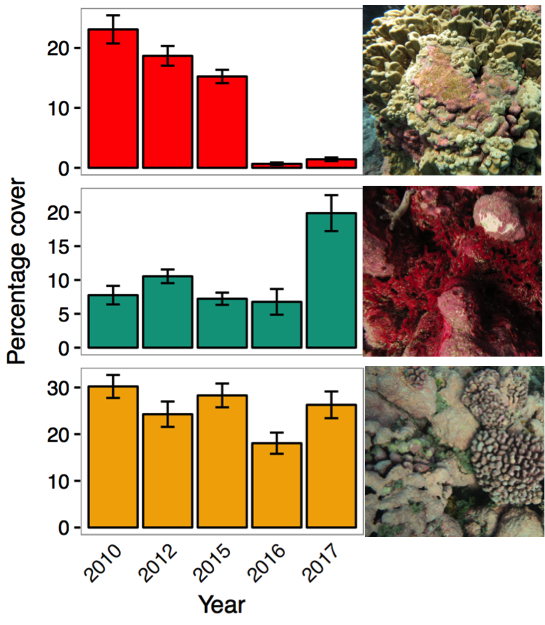
Figure 6. Mean percentage cover estimates (± standard error) of benthic habitat per survey year at Jarvis. Data shown for Hard Coral (top, red); macrolagae (middle, green) and CCA: crustose coralline algae (bottom, orange). Note: no benthic data are available for 2008 as we began collected rapid visual estimates of these benthic functional groups in 2010.
Whether this reduction in specific planktivore, piscivore, and live coral-dwelling fish species is a widespread and long-standing shift in the fish assemblages at Jarvis will be the subject of forthcoming research. It seems plausible that they reflect impacts of a prolonged period of reduced food availability and changes to preferred habitat due to the anomalous warm sea conditions in 2014–2015. Our teams will return to Jarvis in 2018 to conduct another assessment in an attempt to answer some of these questions.

An emaciated grey reef shark (Carcharhinus amblyrhynchus) observed during a 2017 fish survey. (Photo: NOAA Fisheries/Adel Heenan)
Additional detail on survey methods and sampling design are available in the full monitoring brief: Jarvis Island time trends 2008-2017.
References
Gove J. et al. (2006) Temporal variability of current-driven upwelling at Jarvis Island. J Geo Res: Oceans 111, 1-10, doi: 10.1029/2005JC003161.
Williams I. et al. (2015) Human, oceanographic and habitat drivers of central and western Pacific coral reef fish assemblages. PLoS 10: e0120516, doi: 10.1371/journal.pone.0120516.

